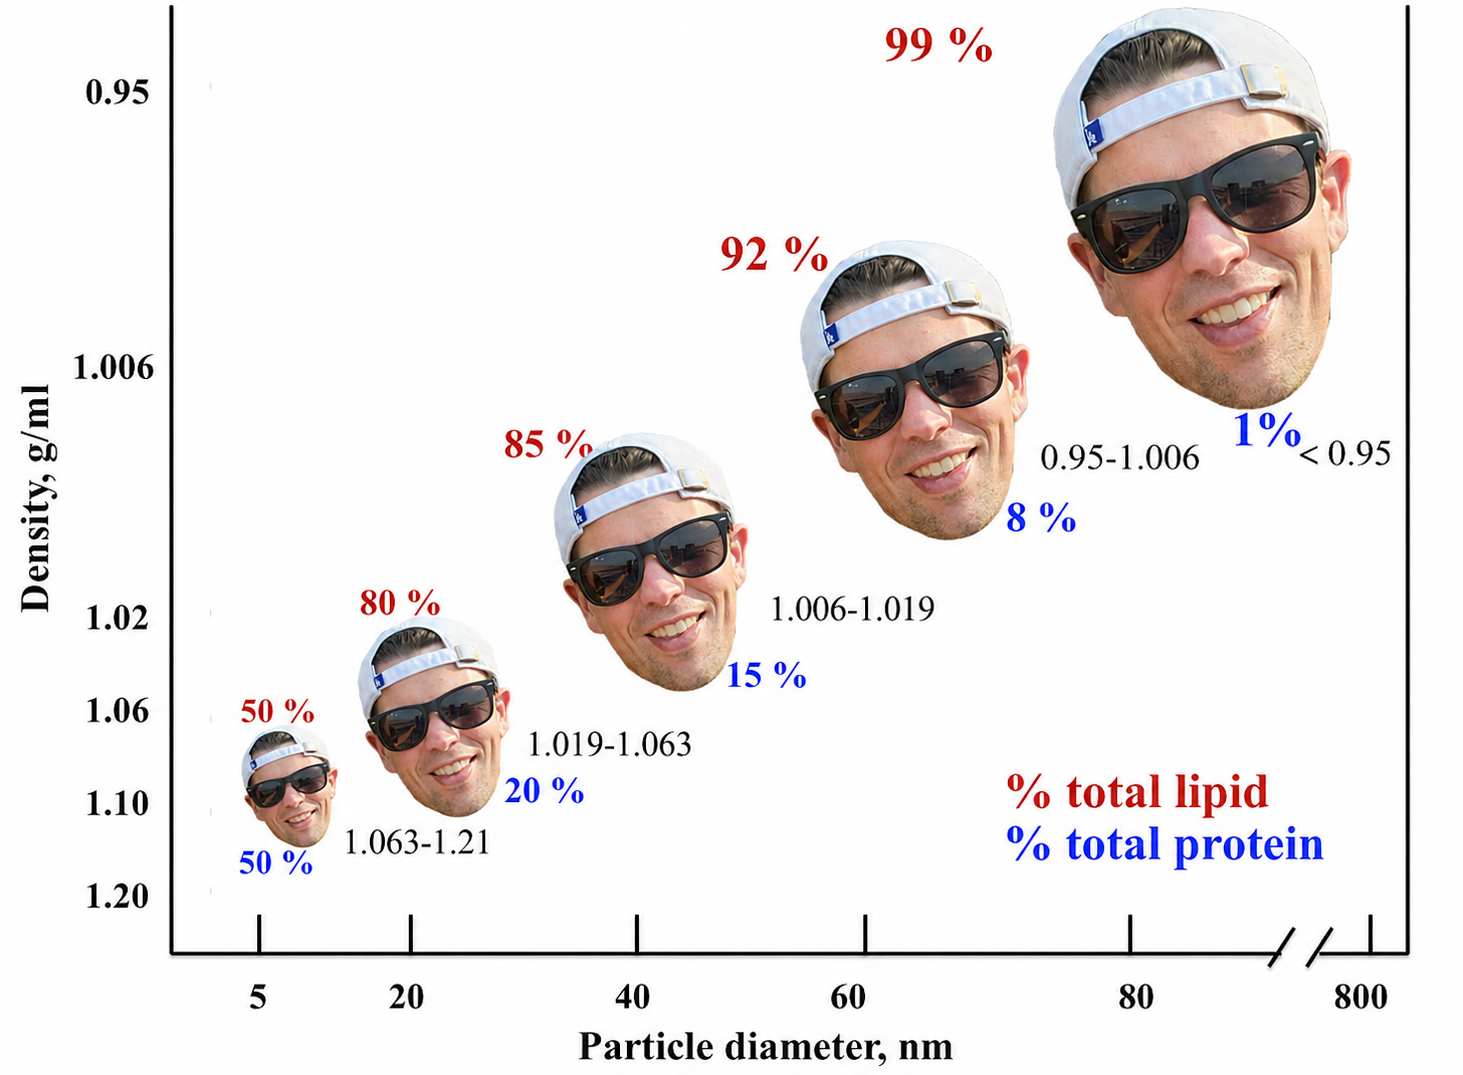
In my ongoing effort to prove that I’m a TERRIBLE entrepreneur, but hopefully a pretty good friend if you need accessible Lipid Resources, below is a Helpful Handbook on Advanced Lipid Panels from the “Remixed 2nd Edition for the Clinician…And Anyone on a Mission for More Lipid Tuition” of THIS BOOK. Bookmark and enjoy!
As I’ve previously stated, most of the subfractionations of HDL, LDL, and VLDL particles are proxies for INSULIN RESISTANCE. And some labs actually will give you what’s called an LP-IR score, which uses the composite data of HDL, LDL, and VLDL subfractionations as a predictor of whether or not someone will eventually develop Type 2 Diabetes. Interestingly, this LP-IR score is actually more predictive of diabetes than more well-known metrics such as HbA1c and even BMI (see, not all Risk Calculators are garbage)! But before we take the plunge, let these aforementioned core concepts guide our discussion:
- PARTICLES DICTATE RISK. When ApoB particles are discordantly elevated for a given mass of LDL cholesterol, cardiovascular risk tracks with particle counts.
- A plasma measure of HDL-C gives you NO IDEA of its functionality
- This also extends to HDL particle quantification and HDL size…although HDL particle counts and sizes may be slightly more correlated with HDL functionality and/or cardiovascular events than HDL-C, it’s still reckless to make sweeping generalizations.
- Advanced lipid metrics as determined by NMR spectroscopy or ion mobility are, in general, additional metrics to identify INSULIN RESISTANCE.
The LP-IR score
The LP-IR score is a composite algorithm of 6 different lipid subfractionation measurements. Any score under 30 is ideal, whereas those above 67 (this would be in the top 25%) had a twofold risk of developing T2DM in the Women’s Health Study. Similarly, those in the top 25% had a 59% increased risk of diabetes in the MESA cohort. The individual components of the LP-IR score are as follows:
- HDL particles (HDL-p)
- HDL size
- VLDL particles (VLDL-p)
- VLDL size
- LDL particles (LDL-p)
- LDL size
HDL Particles: Quantity and Size
So let’s start with our police force, the HDL particles! So, in general, when HDL particles get “fat and fluffy with triglycerides” due to excessive CETP activity, they become like policemen that are TOO BLOATED to pass their fitness test. And then, in the attempted fat loss procedure by unskilled surgeons (hepatic and endothelial lipase), we are left with gaunt, emaciated HDL cops who are now TOO WEAK to pass their fitness test. So the remaining ApoA-1 on the pathetic HDL particles is catabolized by the kidney and eliminated in the urine. This is why we see low HDL-C in people with chronically high triglycerides, and in general this translates to small average HDL particle size and low HDL particle quantity. And in several studies like JUPITER and MRFIT, HDL-p was inversely correlated with cardiovascular events. But, very large (not small) HDL-p was actually associated with INCREASED risk of coronary disease in the EPIC-NORFOLK study…and some of the early studies of fibrates demonstrated that an increase in HDL-p (predominantly of the small variety) was correlated with decreased events! And don’t forget, there are between 1 and 5 ApoA-1 molecules on each HDL particle.
And guess what? Both LARGE and SMALL HDL particles have different functions, similar to how large policemen might be better in a fistfight while wiry guys might be able to better run down a fleet felonious fellow. Large HDL particles tend to be better at efficiently delivering their cholesterol cargo via SR-B1 to tissues that may need it, while small HDL particles seem to be more efficient at effluxing cholesterol out of macrophages in the arterial wall…and I’d say both of those functions are pretty important!
(If your brain isn’t already resembling a heap of scrambled eggs, there are also different combinations of letters and numbers that are somehow supposed to help us “better define” HDL particle size. For instance, the largest HDL particle is called an HDL-2b particle, whereas the smallest particles are of the HDL-3c variety…and then occasionally people will try to throw some Roman numerals in there. Basically, it makes you want to completely defenestrate alphanumerics and maybe learn something more simple, like Japanese or Arabic).
So if you find this confusing, join the club…there are just too many exceptions and too much conflicting data to use any HDL metric in isolation.
So in summary:
- Small average HDL particles are, in general, associated with INSULIN RESISTANCE.
- Low HDL-p, in general, is associated with INSULIN RESISTANCE
- A plasma measure of HDL-C (or HDL size or HDL-p) gives you NO IDEA of its functionality.
VLDL Particles: Quantity and Size
VLDL particle subfractionations are quite a bit easier to understand than their HDL counterparts…but then again, so is quantum physics, neurosurgery, and the mystical pleiotropy of Essential Oils (ok, maybe just the first two). In a fasting sample, VLDL particles are the big-time traffickers of triglycerides. And if fasting triglycerides are high, we would expect to see larger quantities of VLDL-p. Hey, that makes sense! And, in general, if there are more triglycerides around (as in insulin resistance), we would expect the average size of these VLDL particles to be LARGER. So, in general, large VLDL-p size is also associated with insulin resistance.
BUT, it couldn’t be that easy. Because, despite PCSK9 inhibitors having a neutral effect on insulin resistance, if someone is taking one of these agents, it increases the average size of VLDL particles. And additionally, sometimes when a person adopts a low-carbohydrate ketogenic diet, they can also have predominantly large VLDL particles despite having low triglycerides. Darn it! But typically the context will clue you in as to whether or not this may be the case.
So with VLDL:
- Elevated quantities of VLDL-p and large VLDL-p are associated with INSULIN RESISTANCE.
- Large VLDL size is, in general, associated with INSULIN RESISTANCE.
LDL Quantity and Size:
As mentioned, discordantly elevated LDL-p is present in states of insulin resistance because it requires more small particles to transport the same mass of cholesterol. And a small LDL average size (Pattern B for Bad) is almost unequivocally associated with insulin resistance. This shift from Pattern A to Pattern B actually occurs at a fasting triglyceride level of around 95 (demonstrated by the brilliant Dr. Ron Krauss). I’ve often said that a fasting trig of 150 was way too high!
So with LDL-p:
- High quantities of LDL-p, especially when discordantly high for a given mass of cholesterol, are associated with INSULIN RESISTANCE.
- Small average LDL particle size (Pattern B) is almost always associated with INSULIN RESISTANCE.
- And since the NUMBER OF PARTICLES is the NUMBER OF POTENTIAL CRIMINALS in your Lipid Neighborhood, LDL-p gives you a better idea than LDL-c of the type of Lipid Neighborhood you’re living in.
And now hopefully the waters of Advanced Lipid Testing are just a bit less murky…except, of course, for the HDL section of the pool…that’s like the old abandoned hot tub that still harbors a few inches of tepid, stagnant water from Uncle Jay’s pool party back in 1994. It’s a sure-fire recipe for cellulitis if you marinate in there too long. So just wade around in the ApoB side of the pool and you’ll be fine!
NMR Values Typically Associated with Non-Insulin Resistant Persons (target values are either below or above the 50th percentile using data from the LipoScience population)
| Lipoprotein Metric | Target Value |
| Small LDL-p | <527 nmol/L |
| LDL size | >20.8 nm |
| Large VLDL-p | <2.7 nmol/L |
| VLDL size | <46.8 nm |
| Large HDL-p | >4.8 µmol/L |
| HDL size | >9.2 nm |